![]()
'Yak, these colors are really weird !!!'
Color Presentation of Astronomical Images
Till CrednerMax-Planck-Institut für Aeronomie, 1999
![]()
There are thousands of astronomical images, all different in their colors, even if it is one and the same object. For a better understanding of the shown astronomical objects the different forms of image representations are explained. A brief introduction to Color Composites is given and for more advanced readers an enhanced technique of "preserved" colors is introduced. I have kept the text as brief as possible and tried to avoid software topics and related stuff like intensity scaling or color balancing. Many links are courtesy of P. K. Kaiser, York University.
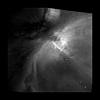 M 42, Orion Nebula |
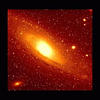 M 31, Andromeda Galaxy | More monochrome images |
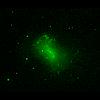
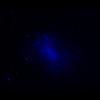
 Comet Hyakutake |
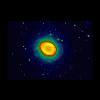 Ring Nebula M 57 | More false color images |
Additive RGB Mixing |
A computer screen and as an approximation also our eyes use the additive
mixing of the three primary colors red, green, and blue, called the RGB Color Model.
Additive means that the light itself (!) is mixed, for example red and green light is
added to yellow. Equal parts of red, green, and blue gives you a neutral color,
i.e. gray or white, depending on the intensities. |
| For constructing a color image, three images have to be taken in different wavelength regions. They are shown with red, green, and blue color bars in the same chromatic order. The example of the galaxy NGC 4449 shows exposures with the astronomical filters (I + H-alpha), V, and B. | 
| 
| 
| |||
| Different filter exposures shown with RGB color bars | ||||||
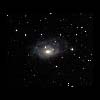
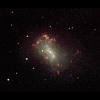 RGB Three Color Composite of the Irregular Galaxy NGC 4449 | The additive combination of these images results in a natural appearing image with all available colors of the RGB Model. But "appearing natural" might be quite different to a real true color image what is explained in the following: | |||||
Natural Colorsor True Colors | Mapped Colorsor Representative Colors |
|---|---|
| If the three different wavelength bands do represent the sensitivity curves of the eyes three different color receptors, we get a "true" or "natural" color image. The astronomical object is shown in a way it would be seen by the eye (if it would be extremely sensitive). | Astronomical science of course is not restricted to the wavelengths of the three human sensitivity curves. The electromagnetic spectrum reaches far beyond and often it is very useful to observe in narrow wavelength bands. To visualize these observations, the images are "mapped" from the original wavelengths to the red, green, and blue color bars. |
 Constellation Orion A conventional color photography has three different layers. The sensitivity curves of these layers approximate those of the human eyes three color receptors and so show natural colors. (But beware of the usual color shifts of emulsions at long exposures.) |
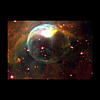 NGC 7635, the Bubble Nebula Narrow band filters are used to determine different gases in nebulae. The chemical abundances and temperatures can be reveiled by such images. To visualize these physical circumstances, the images are mapped onto the RGB-color bars and combined to get a natural appearing(!) image. These images are very different from natural colors. You can compare the above image with a natural color image HERE. |
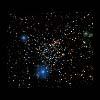
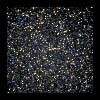 Center of the Globular Cluster Omega Centauri Using the astronomical Johnson R, V (visual), and B filters and representing these with red, green, and blue and the right color balance gives a crude approximation of the human eye. |
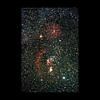
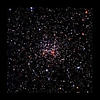 Open Cluster NGC 2194 To examine stellar parameters Johnson I, V, and B broadband filters were used. V and B more or less match the human green and blue sensitivities. But Johnson I is a near infrared filter and was mapped to the red color bar to construct this three color composite. But nevertheless such a stellar image with the right chromatic order is very similar to a true color image, because stars do radiate mainly with continuum and not line emission. |
| More true three color images | The term "false colors" is also used quite often for such representative three color
images, whereas I think this is somewhat misleading, because the shown RGB-colors do
visualize the physical colors within the used wavelength bands. So the shown colors
do have a strong meaning and I propose the more characteristic usage of the above
names and having in mind the observed wavelengths. More mapped three color images |
Additive Mixing of the two complementary colors orange and blue | The most obvious way to construct two color composites on a computer is using the colors orange and a bright blue. In comparison to the RGB-colors as written above, the green color is split into two equal parts and added to red and blue. This is equivalent to constructing the green channel in the RGB-system from the average of the red and blue channel. |
| Two images have to be taken in different wavelength regions for constructing a two color composite. They are presented with orange and blueish color bars in the same chromatic order. The example of the galaxy NGC 1961 shows exposures with the astronomical filters I and V. | 
| 
| ||
| Different filter exposures shown with orange and blue color bars | ||||
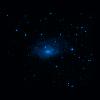
 Two Color Composite of the Peculiar Galaxy NGC 1961 | The combination of these two images results in a natural appearing image. But of course it isn't a natural color image. The resulting colors are restricted to the mixing of the two used primaries. This method is just the best we can do with two available wavelength bands, to show the object as natural as possible. | |||
The above described method of mapped colors also applies to the more general n color techniques.
|
Center of the Globular Cluster Omega Centauri |
 Open Cluster NGC 1245 |
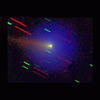 Comet Wirtanen | More images with preserved colors |
All astronomical images are clickable to get the whole HTML-document with description and larger image size.
© all photographs taken by Till Credner and Sven Kohle et al.